The B2B marketing dashboard a CEO actually needs

Most B2B marketing dashboards report activity, not decision-useful signal. What to put on it, what to leave off, and how to report a soft number honestly.
A B2B marketing dashboard should help a CEO decide where to invest, what to fix and whether the commercial plan is still credible. Build it around pipeline, acquisition economics, forecast confidence and delivery health. Every headline needs an agreed definition, a reporting period, an owner and a clear statement of what the number cannot tell you.
The dashboard should connect marketing to the business without pretending marketing controls every outcome. Sales owns its judgement about deals, finance signs off revenue and marketing explains the demand and conversion work behind the plan.
Start with the decision, then choose the measure
A chart earns its place when it helps answer a question the leadership team can act on. Do we need more qualified demand, better conversion or more capacity to handle the opportunities already arriving?
Those are different problems. Increasing campaign spend before understanding which one you have can leave the original constraint untouched.
Put the decision above the chart. “Should we expand this programme?” gives a review more direction than “Marketing performance”, because it forces the team to explain the evidence, the risk and the proposed next step.
Dave Kellogg's marketing metrics for a board meeting makes a useful distinction between creating opportunities and tracking whether they close. It also notes that conversion takes time to observe. Keep both views, rather than rewarding pipeline creation without checking what happens afterwards.
A compact CEO marketing dashboard
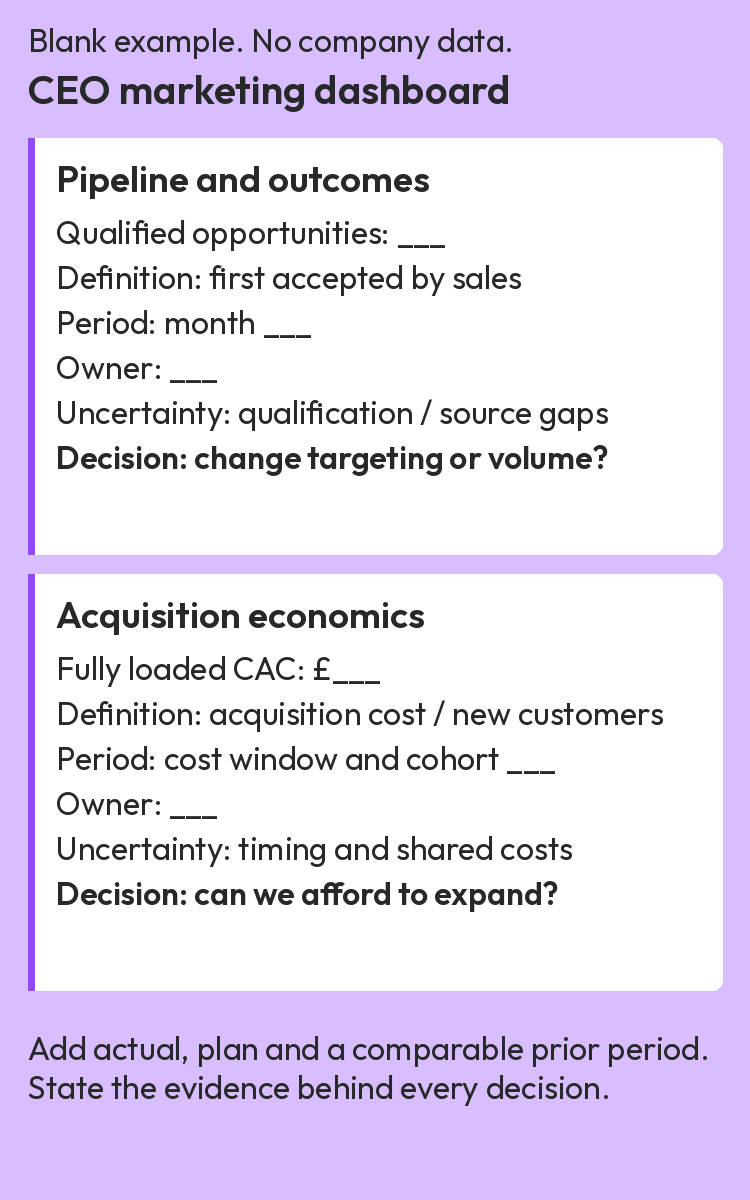
Use the following as a blank template, not a prescribed set of targets. All values are deliberately empty, and the owners are suggested roles to replace with named people.
For each measure, add the actual result, the agreed plan and a comparable previous period or cohort. Date the snapshot and link the underlying CRM, finance or delivery report; a blank means “not supplied”, never zero.
This blank illustration shows the pipeline and acquisition economics sections. The complete definitions and text template follow below.
Pipeline and commercial outcomes
Qualified pipeline created
count of distinct opportunities first accepted by sales during the month, using written qualification criteria. Actual ___ / plan ___ / prior month ___
Suggested owner: Marketing lead, reconciled with sales
Uncertainty to show: Incomplete qualification, missing source and any change in acceptance criteria
Decision it informs: Change targeting or qualification, or increase demand if quality holds
Opportunity-to-win conversion
won opportunities divided by all opportunities in a named creation cohort, measured at a fixed age. Result ___ / cohort size ___ / still open ___
Suggested owner: Sales lead
Uncertainty to show: Unresolved deals and small samples; compare cohorts at the same age
Decision it informs: Investigate poor fit, sales execution or a longer buying process
Recognised revenue
finance-confirmed revenue for the month and quarter to date, on the same basis as the company plan. Actual ___ / plan ___ / variance ___
Suggested owner: Finance lead
Uncertainty to show: Unclosed accounts or adjustments; keep new business, expansion and existing revenue identifiable
Decision it informs: Revisit the commercial plan with the relevant sales and customer owners
Acquisition economics
Fully loaded new-customer CAC
agreed acquisition costs divided by new customers, with the cost window, customer group and timing method stated. CAC ___ / customers ___
Suggested owner: Finance lead, with marketing
Uncertainty to show: Shared-cost allocations, acquisition lag and incomplete cohorts
Decision it informs: Test whether the proposed acquisition investment is affordable
Gross-profit payback estimate
months for an acquisition cohort's cumulative gross profit to recover its acquisition cost. Months ___ / cohort ___ / observed through ___
Suggested owner: Finance lead
Uncertainty to show: Separate observed recovery from projected recovery; name retention and margin assumptions
Decision it informs: Limit, stage or revise investment that depends on uncertain future recovery
Forecast confidence
New-business contract bookings forecast
expected value of contracts signed in the quarter, using an explicit value basis such as first-year contract value. Base ___ / downside ___ / plan ___
Suggested owner: Sales lead
Uncertainty to show: Unconfirmed buying steps, close-date changes and dependence on individual deals
Decision it informs: Address a specific deal risk, revise the forecast or change the plan
Delivery health
Critical commitments at risk
agreed growth-plan milestones due before the next review that are blocked or likely to miss their date. At risk ___ / due ___
Suggested owner: Marketing lead
Uncertainty to show: Dependencies, unconfirmed capacity and the commercial consequence of delay
Decision it informs: Remove a blocker, reduce scope or move resources
This is a starting point. A retention-led business may need renewal risk on the front page; a company entering a new category may need a credible awareness measure. Include either when it changes a current decision, rather than treating acquisition as the whole marketing remit.
Keep meeting bookings, attendance and revenue separate
The word “booking” needs care. A meeting booked in a calendar and a signed contract booking are different events, and neither should silently become recognised revenue.
Consider this hypothetical campaign, with all meetings scheduled to occur by the reporting date:
20 distinct prospects booked a meeting.
15 attended.
6 of those attendees became sales-accepted opportunities.
None had signed a contract by the reporting date, and finance confirmed no recognised revenue from this group.
Attendance was 15 out of 20, or 75%. Qualification was 6 out of 15 attendees, or 40%; measured against bookings, it was 6 out of 20, or 30%.
All three percentages are valid, but they answer different questions. Calling the 20 bookings “qualified leads” hides the qualification step, while calling the six opportunities “customers” invents a result.
Zero revenue so far also says little about the eventual outcome if the normal buying process is still underway. Record the observation date and follow the same group through the process, with reschedules, duplicates and cancellations handled consistently.
Read the commercial pattern before changing spend
If pipeline volume improves while conversion deteriorates, inspect the opportunities before celebrating or cutting the programme. The change could reflect poorer fit, a different segment, a sales-capacity problem or a cohort that simply has not had enough time to close.
Keep count and value distinguishable. If early opportunity values are placeholders, show the count and label the value as an estimate rather than presenting an exact-looking pipeline total.
For conversion, retain the denominator and the unresolved deals. Two wins from four opportunities is 50%, but it is a thin basis for committing a larger budget.
Use source attribution as an agreed reporting view, not proof that a channel caused the revenue. The B2B attribution guide covers that distinction; the CEO dashboard only needs the chosen basis and the limitation that matters to the decision.
Economics need similar discipline. A low acquisition cost does not settle the investment question if the customers leave before the acquisition cost is recovered, or if the proposed expansion reaches a more expensive audience.
Keep the cost allocation detail in the CAC calculation guide and the supporting finance model. On the dashboard, show the agreed basis and the segment whose economics would change the recommendation.
Explain what the forecast depends on
A forecast range is useful only when someone can explain the difference between its cases. “Base £___, downside £___” should lead to named assumptions, such as a buyer completing procurement before quarter-end.
The forecast owner should explain what changed since the previous review. Separate a deal moving to a later quarter from a lost opportunity, and distinguish a missing customer decision from a missing CRM update.
Keep contract bookings and the revenue forecast on their respective finance-agreed bases. Winning a contract this quarter does not justify dropping its full value into the quarter's recognised revenue line.
Avoid an unexplained “high confidence” badge. State the evidence and the unresolved dependency: “The forecast assumes two procurement reviews finish this month; neither completion date is confirmed.”
That gives the CEO something to challenge. If there is no credible intervention left, revising the forecast may be more useful than asking marketing for activity that cannot affect the period.
Make the review produce an action
Agree the review rhythm around when decisions can still change the outcome. A monthly leadership review may suit the main dashboard, with deal risks and delivery blockers checked more often where necessary.
Before the meeting, reconcile disputed definitions and investigate significant changes. The meeting should focus on what the team recommends doing, not on discovering that sales and marketing count opportunities differently.
Record each decision in one line:
“Decision ___; evidence ___; main uncertainty ___; action owner ___; revisit on ___.”
Set intervention rules against the company's plan and risk tolerance, not an unexplained industry benchmark. For example, expansion that would exceed an agreed acquisition budget needs a fresh decision; a dependency missing its last viable date means moving the launch or reducing scope. A small movement from a tiny sample may need investigation rather than a budget change.
At the next review, return to the decision and ask whether the expected change happened. Keep channel activity and detailed diagnostics available underneath, so the team can explain a problem without making every chart part of the CEO pack.
Start by replacing one activity section in your current report with a decision, its evidence and an owner. If the team still cannot agree what the numbers mean, resolve that before adding another dashboard tool. For help connecting the commercial plan to priorities and reporting, see how I work with your team.